For the first article in this series, which explains the motivation and method behind this project, click here.
In this second article, I’ll explain how to get OpenStreetMap data into Python: (1) using Metro Extracts and (2) using geopandas_osm.
Metro Extracts
Much of the time when we’re working with OpenStreetMap data, we’re only focusing on a single city. If that’s the case for you, you’re in luck: you can use MapZen’s convenient Metro Extracts service to download all the city’s OpenStreetMap data in one convenient zip file.
First, head over to the site and download the zipfile for the city you’re interested in.
If you’re interested in street-level data, you’ll want the IMPOSM GEOJSON file.
Unzip it and you’ll find a bunch of files in GeoJSON format. In our particular case we’re interested in the file singapore-roads.geojson,
which looks something like this when nicely formatted, pretty human-readable:
{ "type": "Feature",
  "properties":
      { "id": 5436.0, "osm_id": 48673274.0,
        "type": "residential",
        "name": "Montreal Drive", ...
        "class": "highway" },
  "geometry":
      { "type": "LineString",
        "coordinates": [ [ 103.827628075898062, 1.45001447378366  ],
                         [ 103.827546855256259, 1.450088485988644 ],
                         [ 103.82724167016174 , 1.450461983594056 ],
                         ... ] } }
The special thing about GeoJSON files is the geometry entry which specifies the type of geographic feature as a LineString (or a Point, or a Polygon)
and the latitudes and longitudes of the points that define this feature.
Inspecting this file further, we see that there’s a bunch of roads with no names, a few misspelled road names, etc. We’d like to be able to slice and dice this data, so let’s throw it into Pandas, the Python data manipulation library!
>>> import pandas as pd
>>> df = pd.read_json('singapore-roads.geojson')
Traceback (most recent call last):
  ...
ValueError: Mixing dicts with non-Series may lead to ambiguous ordering.
Sadface. But wait! Here comes GeoPandas to the rescue!
>>> import geopandas as gpd
>>> df = gpd.read_file('singapore-roads.geojson')
>>> df.shape
(59218, 13)
Yay, it worked! So GeoPandas is an extension of Pandas that integrates a bunch of other Python geo libraries: fiona for input/output of
a bunch of different geo file formats, shapely for geodata manipulation, and descartes for generating matplotlib plots,
all in the familiar Pandas interface. Corresponding to the Pandas DataFrame is the GeoPandas GeoDataFrame, which is fundamentally
the same except for the special geometry column (or GeoSeries) that GeoPandas knows how to manipulate. We’ll see more about
geodata manipulation in the next post in the series. For now, let’s quickly generate a plot of the data.
>>> df.plot()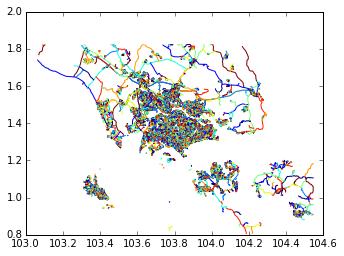
That was easy! Plotting is a quick way of exposing problems with our data: here, we see that we have too much data.
The metro extract was generated using an overly-generous bounding box around Singapore, so we’re getting Malaysian and Indonesian
roads and ferry lines included as well. We’ll see how to filter this to just Singapore roads in the next post. For now, let’s
look at an alternative way of obtaining this data using a library by Jake Wasserman called geopandas_osm.
geopandas_osm
geopandas_osm is a library that directly queries OpenStreetMap via its Overpass API and returns the data as a GeoDataFrame.
Hopefully it will be included in geopandas.io at some point, but it’s completely usable as a separate library.
When querying Overpass, we can pass either a bounding box or a Polygon. To get around the too-many-roads problem, we’ll directly pass it the polygon that describes
the administrative boundaries of Singapore. Conveniently, that was one of the GeoJSON files we were given in the Metro Extracts download, singapore-admin.geojson.
To start, let’s extract that boundary:
>>> admin_df = gpd.read_file('singapore-admin.geojson')

>>> # Inspecting the file we want just the first row
>>> sg_boundary = admin_df.ix[0].geometry

>>> sg_boundary  # In an IPython Notebook, this will plot the Polygon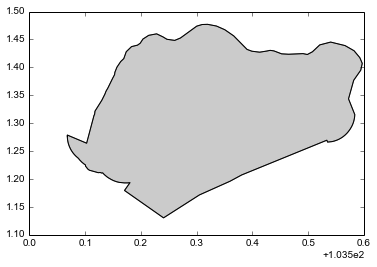
Now we can use it to query GeoPandas via geopandas_osm like so:
import geopandas_osm.osm

# Query for the highways within the `sg_boundary` we obtained earlier from the sg_admin.
# NB this does take on the order of minutes to run
df = geopandas_osm.osm.query_osm('way', sg_boundary, recurse='down', tags='highway')

# This gives us lots of columns we don't need, so we'll isolate it to the ones we do need
df = df[df.type == 'LineString'][['highway', 'name', 'geometry']]

df.plot()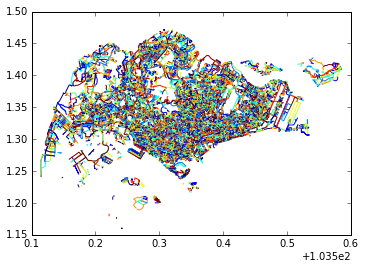
That’s all!
Comparison
So why go with one over the other? Obviously, if your data isn’t limited to a single city or it’s a city not included in Metro Extracts, you may not have a choice.
Apart from that, the most important difference is that the Overpass API gets updated once a day, versus once a week for Metro Extracts. If you spot some egregiously wrong features in OpenStreetMap and go ahead and edit them (as you can, since it’s open!), your changes may not be reflected for some time with Metro Extracts.
As for whether downloading the zip file, unzipping it, and processing the appropriate GeoJSON file is more or less convenient versus querying OpenStreetMap directly, that’s entirely up to your workflow.
In the next post, I’ll show two examples of geographic manipulation with GeoPandas and a related library, Shapely. The first, simple example will filter our bounding box-derived dataframe with too many roads down to just those within the administrative boundaries. The second, slightly more complicated example will compute the median point of all roads that share a name. See you then.